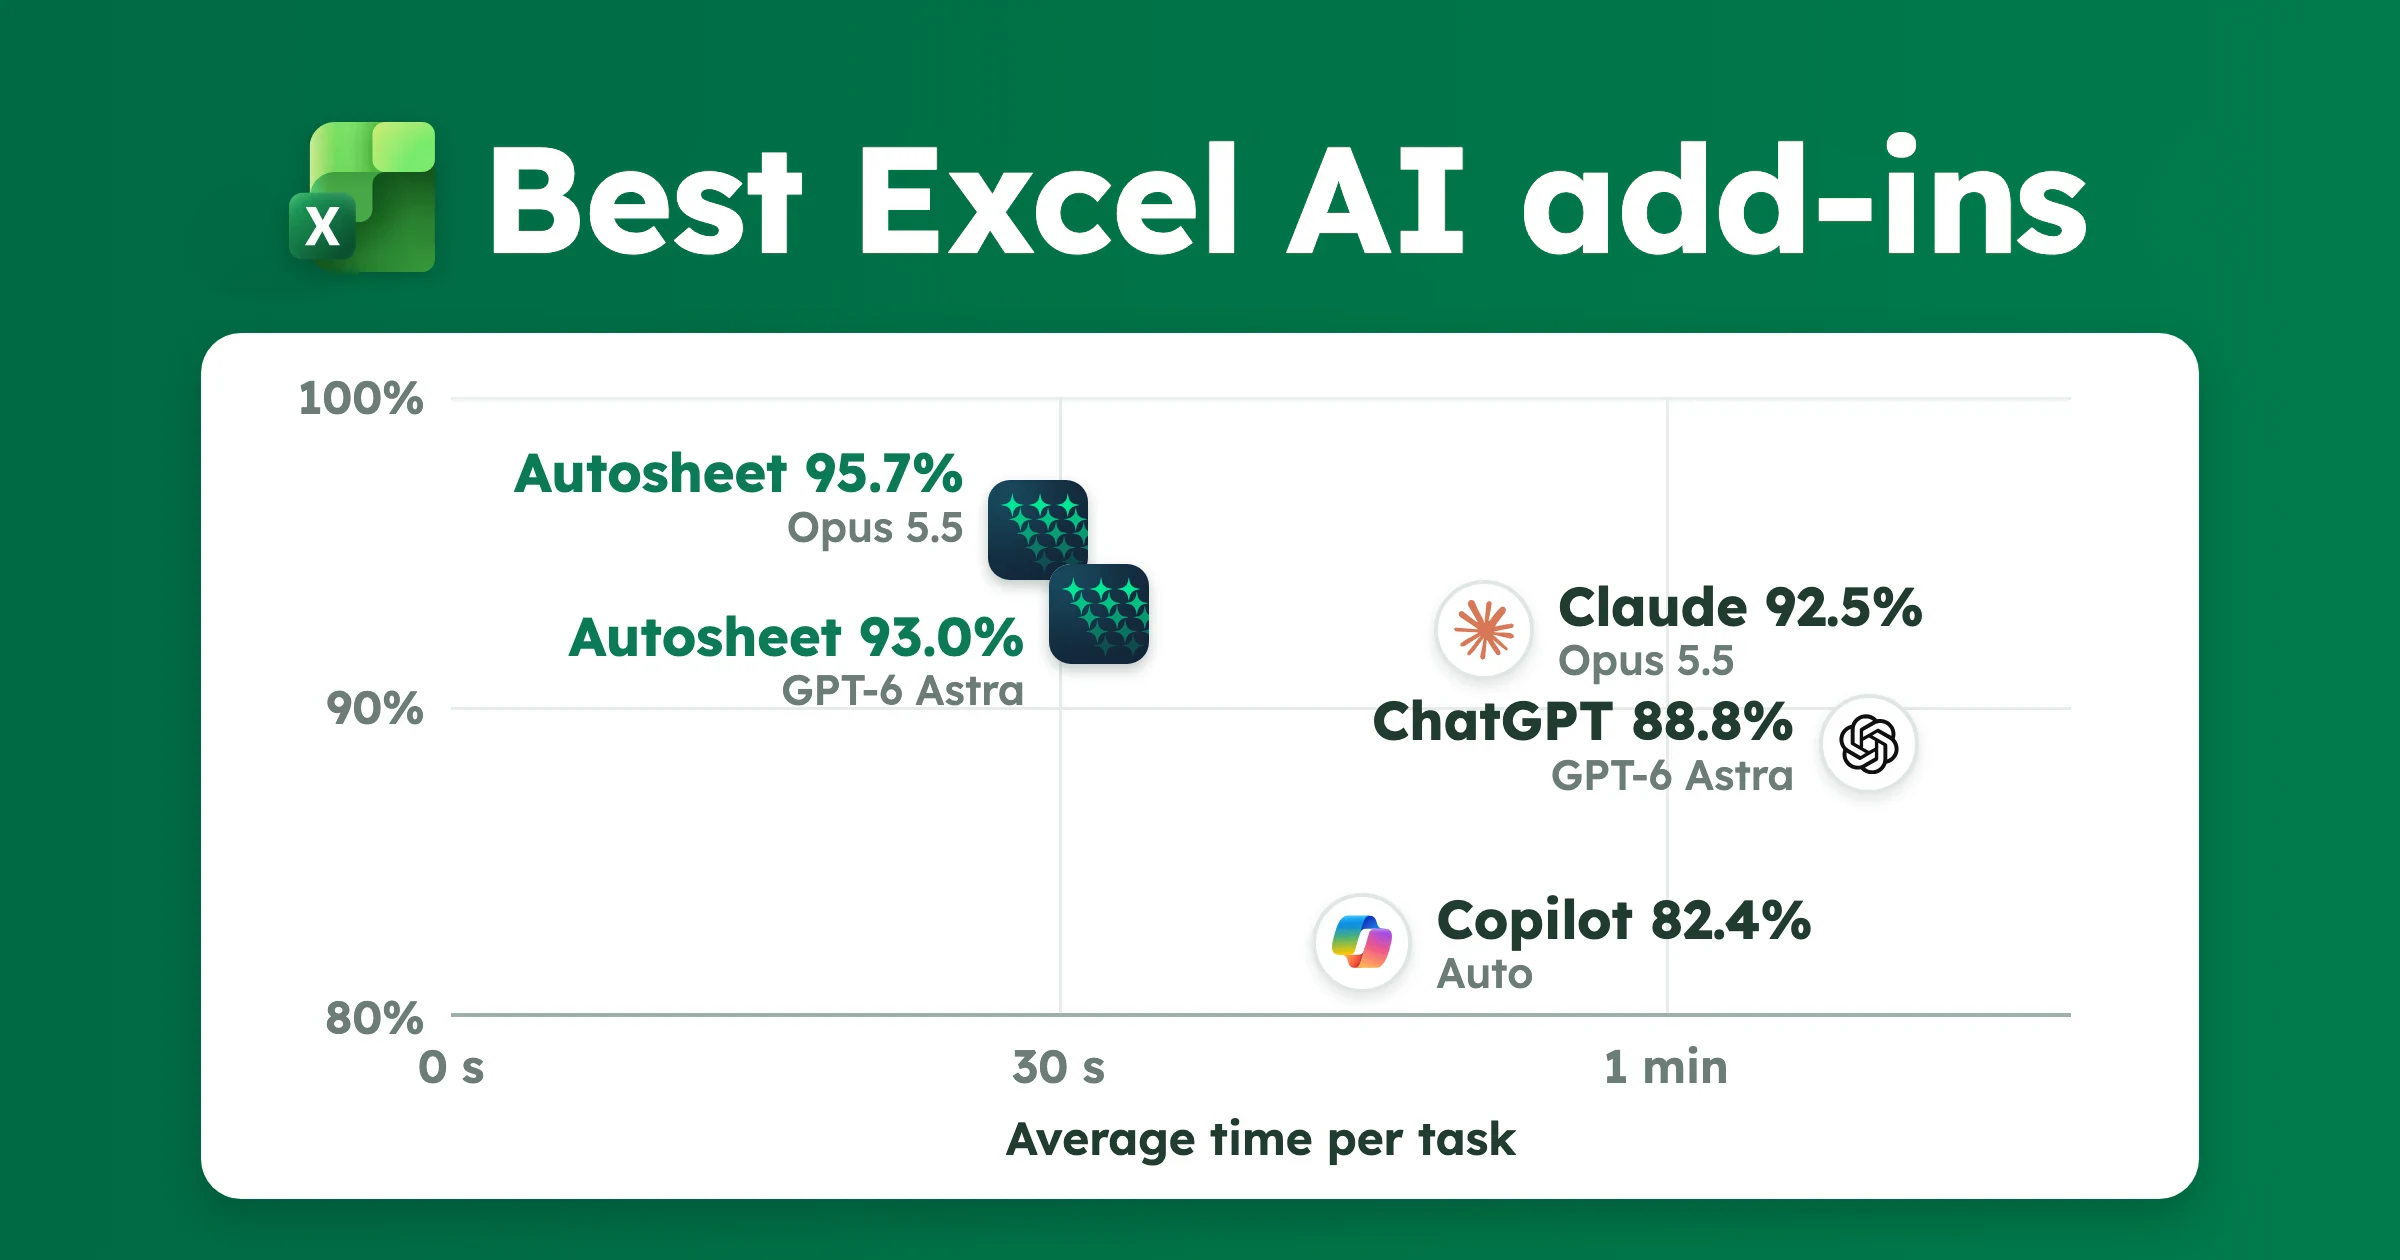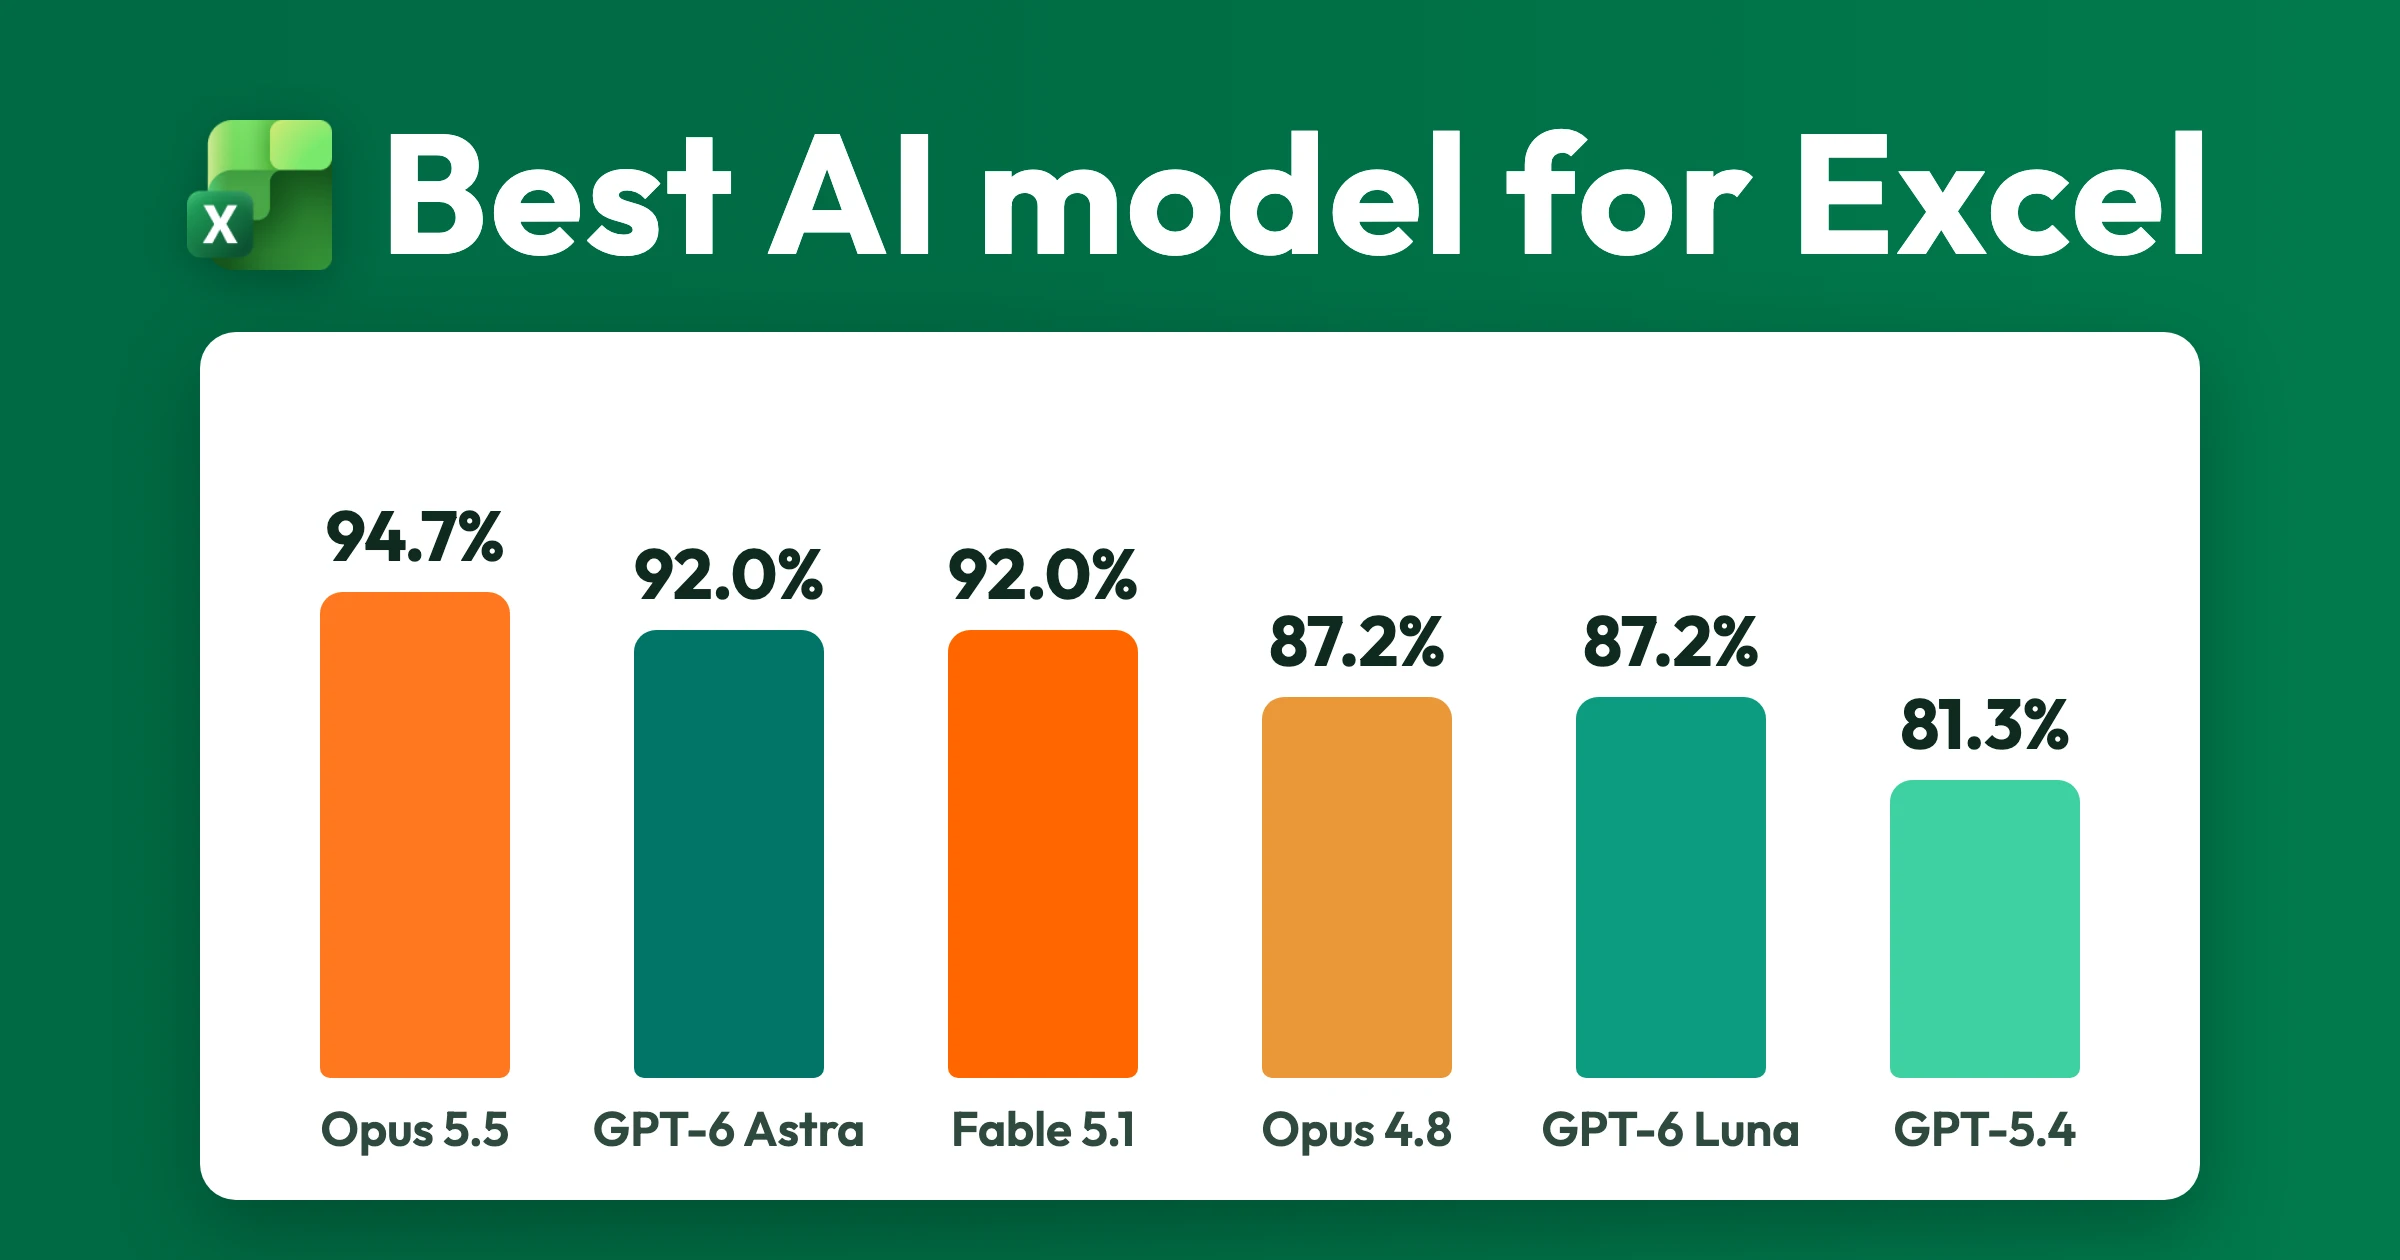
AutosheetBench runs real spreadsheet AI products through their live Microsoft Excel and Google Sheets interfaces, where the product around the model can matter a lot (eg: in Excel, Haiku 5.5 in Autosheet is as good as Opus 5.5 in Claude, and twice as fast). Today, we are proudly releasing AutosheetBench open-source (  ): 187 everyday spreadsheet tasks tested across 12 shipped AI products in 22 configurations (each configuration is one product paired with one model and one reasoning effort level).
The benchmark covers:
- The four major Excel sidebar add-ons: Autosheet, Claude, ChatGPT, and Copilot.
- The four major Google Sheets sidebar add-ons: Autosheet, Claude, ChatGPT, and Gemini.
- Four pairings of a general-purpose assistant with an MCP server for Google Sheets: Claude Code + Sheets MCP, Claude Code + Autosheet MCP, ChatGPT + Autosheet MCP, and ChatGPT + Drive MCP.
Testing live products meant building more than prompts and checks: an automated macOS accessibility runner for Excel, a computer-use guide for Google Sheets and MCPs, a hint-free reply for mid-task questions, and a frame-by-frame video timer for run durations. We build Autosheet, one of the products tested, so everything is public: anyone can audit our scores or run the tasks on their own.
Overall results
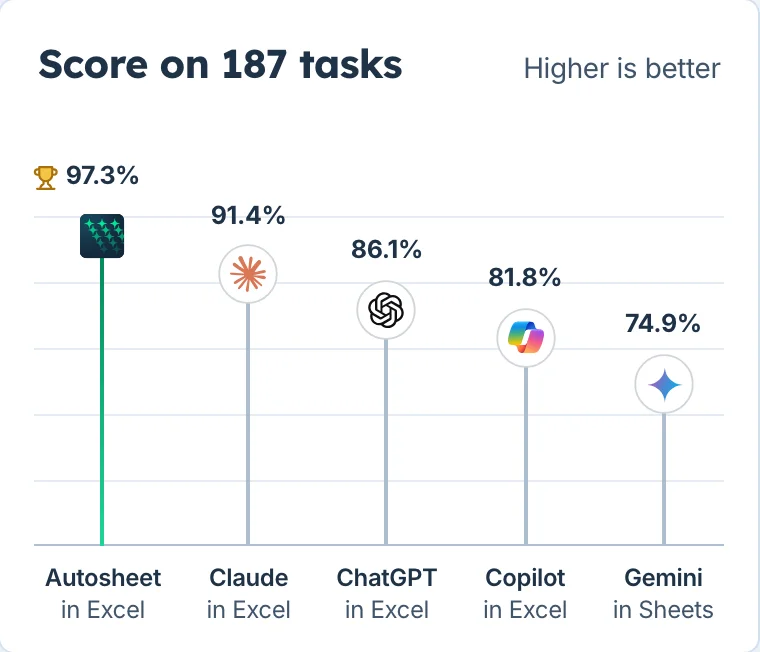
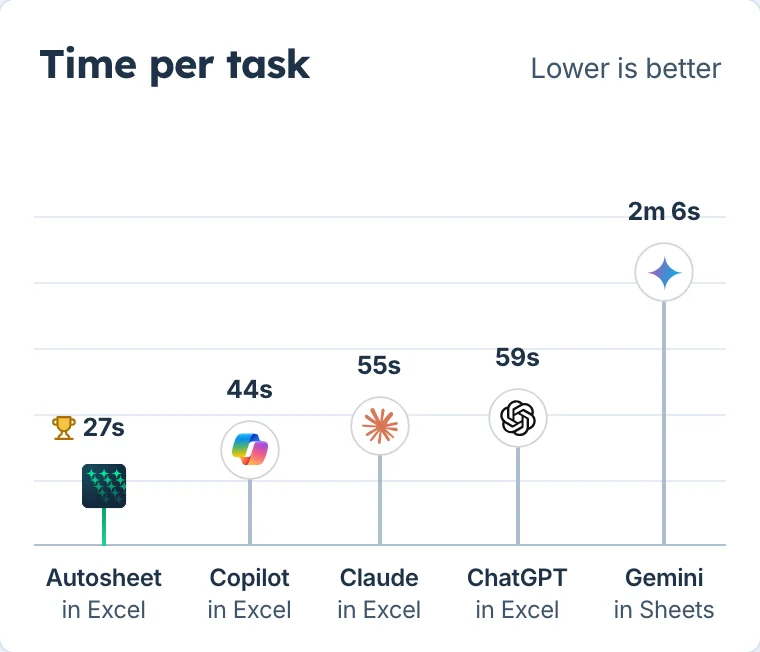
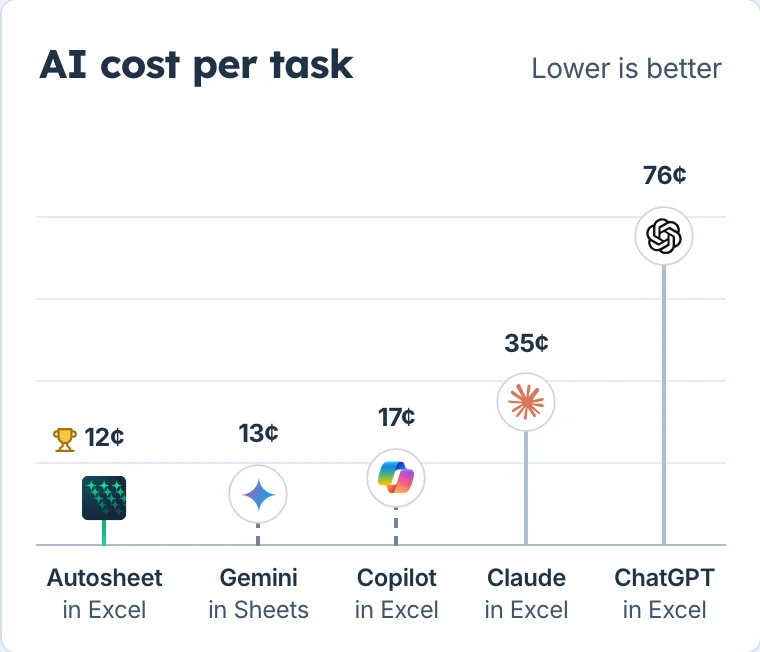
Chart data as a table
AutosheetBench at a glance across 187 tasks for the five sidebar add-on families, each on its best model and platform (latest run November 17, 2026). AI cost per task is what a run's model calls and web searches cost at the AI providers' November 2026 API list prices. Copilot in Excel and Gemini in Sheets record no token usage, so their AI cost per task reflects their monthly plan divided by 187 tasks.
Product | Model and effort | Tasks passed (of 187) | Score | Average time per task | AI cost per task | AI cost kind |
|---|---|---|---|---|---|---|
Autosheet in Excel | Opus 5.5 · Medium | 182 | 97.3% | 27 s | 12¢ ($22.30 total) | Tokens at API list prices |
Claude in Excel | Opus 5.5 · High | 171 | 91.4% | 55 s | 35¢ ($65.73 total) | Tokens at API list prices |
ChatGPT in Excel | GPT-6 Astra · Medium | 161 | 86.1% | 59 s | 76¢ ($141.97 total) | Tokens at API list prices |
Copilot in Excel | Auto | 153 | 81.8% | 44 s (upper bound) | 17¢ ($31.50/mo plan) | Plan's month (no tokens recorded) |
Gemini in Sheets | Auto | 140 | 74.9% | 2 min 6 s | 13¢ ($24/mo plan) | Plan's month (no tokens recorded) |
Those headline numbers are just the entry point. Head to the AutosheetBench results page to filter across all 22 configurations by platform, product type, or model tier (best, fastest, cheapest), inspect the score-vs-duration and score-vs-cost scatter plots, or compare any two configurations head to head by capability.
Example
Before getting into methodology, here is one task from the benchmark: Build a cash-flow waterfall chart.
The starting workbook has a single sheet (Cash Flow) with seven rows in A1:B7:
Stage | Amount |
|---|---|
Starting cash | 500000 |
Operating cash flow | 185000 |
Capital expenditure | -120000 |
Debt repayment | -75000 |
New financing | 90000 |
Ending cash | 580000 |
The prompt:
Build a waterfall showing the cash-flow bridge.Notice what the prompt leaves unsaid. Starting cash (500,000) and Ending cash (580,000) are balances, while the four rows between them are incremental movements (500,000 + 185,000 - 120,000 - 75,000 + 90,000 = 580,000).
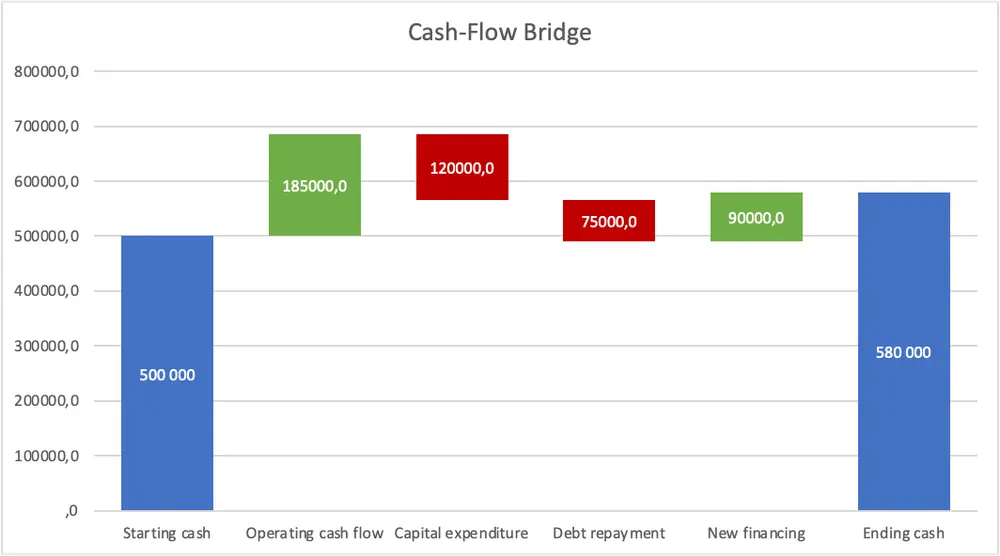
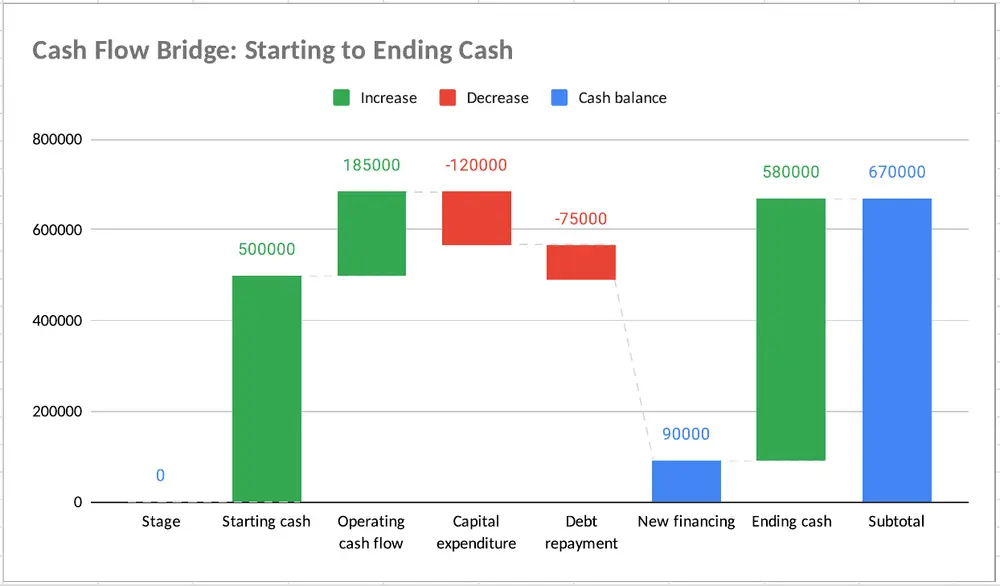
To pass, the output has to satisfy three checklist criteria—every one required:
- A waterfall chart shows the cash-flow bridge from starting cash to ending cash.
- Positive and negative movements go in the right direction and the ending total is 580,000.
- The chart is readable, titled appropriately, and does not obscure or alter the source data.
16 of 22 configurations passed. The 6 failures broke in four distinct ways:
- Treating
Ending cashas an increment instead of a closing balance - Leaking the header row and mis-indexing totals
- Placing the chart on top of the source table
- Skipping a native chart altogether
You can inspect all 22 outputs and failure reasons on the task page.
Everything is open-sourced: the tasks, the scorer, the results
- The tasks, the scorer and the Excel runner are on GitHub, in run-autosheet/AutosheetBench. Each task is a folder with its starting workbook, its prompts in order and its checks or judge's checklist.
- Every result is on Hugging Face, in autosheet/AutosheetBench: 4,114 results, one per task and configuration, with the output workbooks, the transcripts, the screenshots and the recordings, and a viewer that works offline.
- Every task has its own page on our site, such as Create a Gantt chart, with its starting sheet, its pass criteria, and each configuration's output and the reason it failed.
- Any two configurations can be compared head to head, capability by capability, down to the tasks one passed and the other failed, in the head-to-head view.
- The scorer can be rerun on the published outputs. The dataset's
scorer-replay.jsondoes it offline for the results scored by automatic checks alone: the public scorer reproduces all 1,166 verdicts in Excel, and 1,123 of the 1,160 in Google Sheets, where the export to XLSX accounts for the gap (explained under "Auditing edge cases openly"). The file lists every disagreement. - You can run it on your own product. The easiest way to start is to point your favorite coding agent at the repository and ask it to run one task.
The scorer and the runner are licensed under Apache-2.0, and the tasks and the scores under CC BY 4.0, except a few third-party inputs listed in the dataset card.
How we built the tasks
To decide what belonged in the suite, we analyzed tens of thousands of anonymized Autosheet conversations and broke multi-step user requests into individual spreadsheet tasks covering charts, formatting, and spreadsheet updates users ask for most often:
| Chart type | Prompts mentioning it | Distinct users |
|---|---|---|
| Bar / column | 3,138 | 2,163 |
| Pie / donut | 2,197 | 1,530 |
| Line | 1,388 | 1,010 |
| Histogram | 649 | 449 |
| Scatter | 583 | 428 |
| Gantt | 452 | 319 |
| Combination / dual-axis | 311 | 176 |
| Formatting type | Turns | Share of all turns |
|---|---|---|
| Column widths / row heights / autofit | 169,566 | 21.73% |
| Fonts, bold, size, text color | 165,845 | 21.25% |
| Background colors / fills | 156,867 | 20.10% |
| Number formats | 136,927 | 17.55% |
| Alignment / text orientation | 87,041 | 11.15% |
| Text wrapping | 68,414 | 8.77% |
| Borders | 46,028 | 5.90% |
| Conditional formatting | 31,910 | 4.09% |
| Operation | Turns | Share of all turns |
|---|---|---|
| Copy/paste or duplicate | 108,646 | 13.92% |
| Create worksheets | 40,904 | 5.24% |
| Freeze/unfreeze panes | 30,741 | 3.94% |
| Merge cells | 26,663 | 3.42% |
| Data validation / dropdowns | 21,039 | 2.70% |
| Create structured tables | 20,227 | 2.59% |
| Reorder worksheets | 16,147 | 2.07% |
| Delete rows | 10,706 | 1.37% |
| Insert rows | 9,562 | 1.23% |
| Delete columns | 9,291 | 1.19% |
| Apply/change filters | 8,170 | 1.05% |
| Sort ranges | 7,648 | 0.98% |
| Insert columns | 6,942 | 0.89% |
| Unmerge cells | 6,414 | 0.82% |
From that distribution, we manually crafted 159 native spreadsheet tasks across six capabilities (42 formulas, 36 spreadsheet manipulation, 30 charts, 26 formatting, 17 data operations, and 8 pivot tables) and 28 bulk tasks across two capabilities (17 bulk data processing and 11 bulk content generation, operating on up to 1,000 rows per sheet). 22 of the 187 tasks include scripted follow-up prompts sent after the first turn completes.
Prompts stay intentionally under-specified
One trap in synthetic benchmarks is writing overly detailed prompts that read like unit-test specs. Real spreadsheet users don't write like that. They leave spreadsheet mechanics implicit:
- A real user writes "Highlight figures that are same" and expects conditional formatting, not static yellow fill that goes stale the moment a cell changes. Our benchmark task Highlight duplicate email addresses asks simply
"Highlight duplicate email addresses."—without mentioning conditional formatting. - A real user writes "Show only HC entries not others" and expects a filter, not deleted rows. Our task Filter rows above a revenue asks
"Show rows where revenue is above 10,000."—without saying the word "filter". - Real users routinely follow up
"Create a pie chart"with"Add percentages to Pie Chart", showing they expect readable data labels even when they don't spell them out on turn one.
How the runner works
In Excel, it's a script that works on its own once launched, with no person and no AI agent in the loop. It drives the add-in (Autosheet, ChatGPT, Claude or Copilot) through macOS accessibility: it opens a fresh copy of the workbook, starts a screen recording, types each prompt into the add-in's chat, waits for the answer, then saves the workbook, the transcript and screenshots of the output. The runner and its guide are in the repository.
In Google Sheets, and for the assistants connected through an MCP, a computer-use agent, an AI agent that operates the screen, drove Chrome through the same steps, following a written guide.
The reason why we scripted Excel is we couldn't run Excel in the foreground, and thus needed to script it so that it went faster than a 100% computer use solution. As Google Sheets needn't run in the foreground, we didn't have that speed problem and could parallelize computer use.
In both cases the runner is able to detect and answer mid-task questions asked by the product, without giving hints, in order to keep the run going.
We measured time on the screen recordings in order to get true durations. A script goes through each recording frame by frame and counts only the time the product is working, from the moment the prompt is sent to the end of the answer, leaving out the waits between turns and on permission cards.
How we ran the tasks
Every number on AutosheetBench is pass@1: the first run that finished cleanly, never the best of N attempts.
- Strict rerun policy. We only discarded a run and restarted from a fresh workbook when something outside the product failed: a network drop, credits or a usage cap running out (for instance, Gemini in Sheets exhausted its monthly AI credit allowance mid-benchmark and required waiting for monthly renewal plus a plan upgrade), a model at capacity, a runner or computer-use mistake missing a prompt, or a task input/prompt revision. Every rerun is logged in a
rerun-review.jsonfile in the dataset. - Hard time limits. Regular tasks have 5 minutes; the 26 long bulk tasks (up to 1,000 rows) have 10 minutes, shared across all turns. When time expires, we stop the product and score the workbook as it stands. Across all 4,114 runs, 54 runs hit the time limit—and 7 of them still passed.
Here is what one recorded run looks like—Claude in Excel (Opus 5.5 · High) completing Chart sales stacked by region in 9.2 seconds, with the sheet beside the chat pane so every step is auditable:
How we judged the tasks
Every task is strict binary pass or fail—no partial credit. A single missed check or missed rubric checkpoint fails the task. Across the 187 tasks, we combine three evaluation mechanisms depending on what the task actually asks for.
1. Deterministic workbook checks (96 native tasks)
Whenever a task has a verifiable workbook state, Python scripts inspect the actual .xlsx structure—cell values, data types, formulas, conditional formatting rules, filters, and frozen panes—not just what the sheet looks like visually. When there are multiple valid spreadsheet approaches, every valid way is accepted.
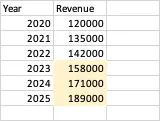
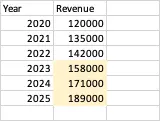
Take Highlight revenues above a threshold ("Highlight revenues over 150000 with a light yellow fill.", passed by 17 of 22 configurations). Visually, the two outputs below look identical. Deterministic inspection catches the difference immediately: Claude in Excel added a dynamic conditional formatting rule (=B2>150000 or cell-value rule), while Copilot in Excel painted static yellow fills onto B5:B7 by hand—so if a revenue number changes, the highlight breaks.
The same strictness catches subtle spreadsheet cheats elsewhere: in Fix numbers stored as text, a product that leaves the amounts stored as text strings and works around the broken total with =SUMPRODUCT(--B2:B6) fails, because the check inspects cell types, not just the displayed total.
2. LLM judge with a hand-edited checklist (63 native tasks)
For 63 native tasks—charts, dashboards, cover sheets, visual formatting, and 6 exact-answer chat questions—a rigid script cannot reliably capture every valid layout. Instead, an LLM judge grades the output workbook summary, externally captured post-run screenshots, and the transcript against a hand-edited checklist of pass/fail checkpoints.
We run Gemini 3.8 Flash through OpenRouter for three reasons: it is independent of both OpenAI and Anthropic (which power most of the products tested), we calibrated its verdicts against human expectations, and it keeps verification affordable—roughly 1¢ per checklist-judged output and 10¢ per quality-judged bulk output (about $39 in total to judge the benchmark once, roughly one-fifth of what Opus 5.5 would cost).
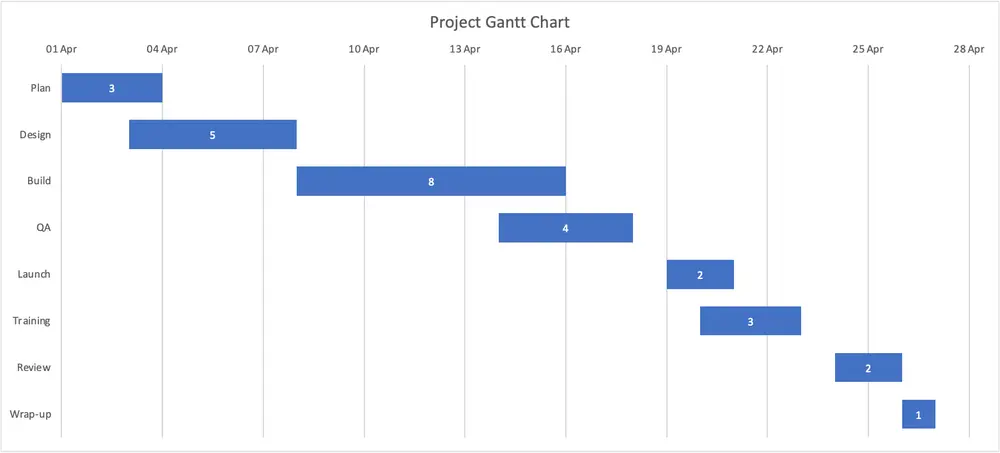
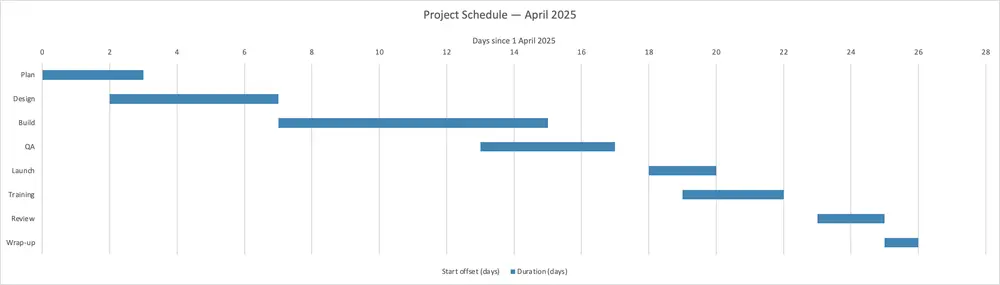
Take Create a Gantt chart ("Create a Gantt chart.", passed by 9 of 22 configurations). Both products below draw floating horizontal bars. ChatGPT in Excel fails because its horizontal axis counts raw days from the start (0, 2, 4, 6) instead of calendar dates—a detail the four-word prompt never spelled out, but that any person reading a project schedule expects.
Visual judging also catches rendering bugs that pure workbook XML misses: in Add thousands separators (passed by just 3 of 22 configurations), products that apply the right number format without widening column B leave numbers hidden behind ######—and fail.
3. Whole-set bulk checks, quality sampling, and anti-boilerplate gates (28 bulk tasks)
Bulk tasks ask a product to apply an AI prompt across hundreds or up to 1,000 rows—for example, classifying support tickets, translating product catalogs, or summarizing job descriptions. Every bulk task runs deterministic whole-set checks (bringing the total to 124 automatically checked tasks across the benchmark: 96 native and 28 bulk), and 14 of the 28 also require an LLM quality judgment. Because Autosheet routes bulk tasks row-by-row to a dedicated bulk model (a lightweight model configured separately from the main agent model) while other products often write code or loop in context, naive spot checks would completely miss how products actually fail at scale.
Our bulk scorer layers three checks:
- Whole-set structural and accuracy checks: Every row must be filled and follow the prompt's constraints (length caps, allowed label sets, non-empty outputs). When each row has one right answer (14 tasks), at least 98% of rows must match (100% on 3 strict tasks).
- Row-level quality judge (14 open-ended text tasks): For tasks where wording varies (summaries, translations, replies, SEO descriptions), Gemini 3.8 Flash runs at high effort and temperature 0 (medium effort let real errors through) and grades 50 sampled rows independently against their source text. At least 45 of 50 must pass a strict bar: "Fail the row when an ordinary careful non-expert could readily make it more accurate, focused, complete, grammatical, or useful."
- Anti-template gate: On text-generation tasks, a deterministic script automatically fails the run if 10 or fewer sentence templates cover 80% or more of the rows (and on synthetic dataset generation, the judge fails outputs that recycle entries or splice a handful of reused words).
Summarize job descriptions (passed by 10 of 22 configurations) shows why structural checks alone are dangerously blind. Copilot in Excel filled all 1,000 rows with summaries under the 160-character limit—passing every structural rule—yet the quality judge rejected all 50 sampled rows. Looking inside the sheet revealed why: 845 of Copilot's 1,000 summaries started with "Lead teams and projects", pasting stock duties onto unrelated roles:
Row | Source job description excerpt | Copilot in Excel output (rejected) | Why it failed |
|---|---|---|---|
461 | "…extracting actionable insights to help empower businesses to better manage their fleets." | "Lead teams and projects, build machine-learning models, and analyze complex data to improve healthcare decisions." | Hallucinated boilerplate: the role serves vehicle fleets, not healthcare. |
324 | "This position is primarily responsible for coordinating and conducting day-to-day activities in the laboratory to ensure timely and accurate testing." | "Lead teams and projects, deploy production solutions, and analyze complex data to advance research and healthcare outcomes." | Hands-on lab coordinator turned into generic data/software boilerplate. |
Auditing edge cases openly
Even a careful automated pipeline runs into platform edge cases. When Google Sheets exports a workbook to .xlsx, it silently drops sheet protection, strips checkbox validation, flattens histograms into images, loses logarithmic axis flags, and extends filter ranges over a total row. Rather than penalizing products for Google Sheets' export quirks—or letting static fills slip past an image judge—we inspected those edge cases in the native Sheets UI and documented every single manual override in results.jsonl (manual_score and manual_review_reason), including flipping false-negative automatic fails to passes for Claude in Sheets and ChatGPT in Sheets.
Inspecting those failures also turned up genuinely wild agent bugs—such as Claude in Sheets (Opus 5.5) timing out on Generate 1,000 sample CRM records because its generated Apps Script tried to sample 1,000 unique company names in a while loop from a pool of 40 prefixes × 24 suffixes = 960 possible combinations, deadlocking forever before writing a single cell.
Limitations
No benchmark is perfect, and we would rather state the caveats plainly—the same ones documented in the Hugging Face dataset card:
- Point-in-time snapshot. Real AI spreadsheet products ship updates continuously. Published results reflect the products as they behaved when run (latest run November 17, 2026); rerunning today may not reproduce a published score.
- Single run per task (pass@1). Every score comes from the first clean run rather than multi-trial averages, so small gaps of one or two tasks should be read cautiously.
- 73 of 187 tasks are saturated. All 22 configurations passed 73 of the tasks; the remaining 114 drive the ranking differences.
- Google Sheets is scored from
.xlsxexports. The export loses some native features, so a few verdicts needed a manual check in Sheets itself. Each one is recorded inresults.jsonl. - Automated runner covers Excel only. The macOS runner drives the four Excel add-ins automatically. Google Sheets and MCP runs used a computer-use agent following
docs/computer-use.md(not shipped in the repository). Where recordings did not capture a clean turn end (138 Copilot in Excel runs and 64 runs of other assistants), durations fall back to runner-clock upper bounds. - Post-run anonymization and withheld artifacts. 27 task inputs were cleaned after runs used them to strip personal data or workbook metadata (
historical_input_sha256records the exact file tested; 11 of those tasks withhold output workbooks and transcripts). Of 4,114 runs, 3,604 screen recordings are published (masked and frame-screened with no audio) and 510 are withheld. Trimmed recordings still include inter-turn waits, so useduration_secondsrather than video length. - Non-deterministic LLM judges. Checklist and quality judgments use Gemini 3.8 Flash and are not bit-for-bit deterministic across repeated calls; changing the judge model makes scores non-comparable with ours.
- We are one of the vendors. We build Autosheet. We built AutosheetBench first to improve our own product and opened every artifact so you don't have to take our word for any score.
If you spot an issue in a task, a rubric, or a verdict—or if you run AutosheetBench on your own spreadsheet agent—open an issue on GitHub or email us at nicolas.augusti@talarian.io or stan@talarian.io. And if you want to explore the numbers, the AutosheetBench page has the full interactive explorer, CSVs, and BibTeX citation.